When Baseline Beats Machine Learning

Updated: Aug 3

At the end of the last post I admitted something and moved past it quickly, because it stung. For one of my three forecast targets, nothing I trained beat a one-line baseline, so I shipped the baseline. This is that story.
The part that took me longest to accept is that it was not close. The most sophisticated model I built, an LSTM that won my revenue leaderboard outright, was the single worst row on the free-cash-flow board. Worse than both gradient-boosted trees. Worse, by a wide margin, than assuming this quarter's free cash flow matches the same quarter a year ago.
That last option is not a model. It is a group-by and a shift. It won.
Three targets, one yardstick, three different answers
FinSight forecasts next-quarter revenue, operating income, and free cash flow for around 117 US companies. By this point in the series the setup is familiar: every value reconstructed as it was known at the time, every target reshaped into a one-step change a model can actually produce, and then every model scored the same way — reconstructed back to dollars and measured with per-company MASE against a seasonal-naive benchmark, the value four quarters ago. One yardstick, applied identically to all five models.
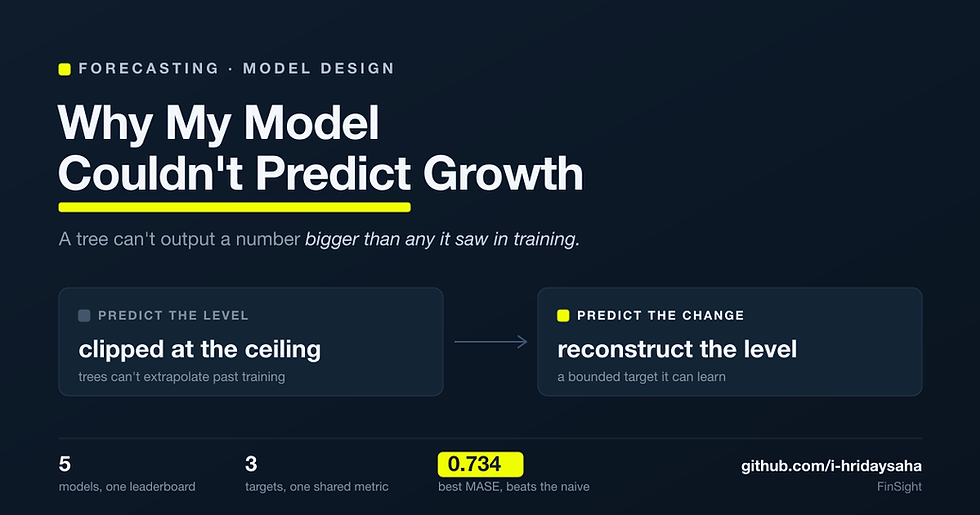
Three targets went three ways. Revenue was a clean LSTM win at MASE 0.734, comfortably under the benchmark. Operating income was a statistical tie. Free cash flow was this:
Free cash flow (106 companies / 844 quarters) | MASE |
Seasonal-naive (t−4) — served | 1.551 |
Prophet | 1.581 |
LightGBM | 1.936 |
XGBoost | 1.975 |
LSTM | 5.156 |
The baseline's 1.551 is the number to beat. Nothing beat it. The closest any learned model came was Prophet, and it still lost by a hair. The LSTM did not merely lose. Its RMSE of 12.65 billion against a mean absolute error of 2.23 billion says a handful of individual forecasts detonated.
Same code, same features, same reconstruction that was winning revenue. So my first assumption was the same one I made in every earlier chapter of this project: I had a bug.
There was no bug
There was not one. The free-cash-flow forecasts ran through the identical code path as the revenue forecasts that were winning. What I was looking at was the algorithm behaving correctly on a target that punishes flexibility. Two things were happening, and the leaderboard only made sense once I saw both.
The reconstruction amplified errors. The last post described the differenced target — free cash flow is predicted as an asinh-delta because it crosses zero — and named, in passing, a cost: companies ranging from single-digit millions to tens of billions sit in different regimes of that transform. I did not follow that cost to its consequence. Here it is. Reconstructing a dollar figure runs the prediction back through sinh, which un-compresses large magnitudes. A small error in transform space, for a large-magnitude company, expands into an enormous error in dollars. The LSTM is free to emit larger deltas than the trees, so every so often it produced one that, expanded back through sinh, yielded a preposterous number. That is why its RMSE dwarfs its MAE. It explained the LSTM's collapse — but not why the well-behaved trees lost too.
There was almost nothing to learn. SHAP on the free-cash-flow model was the quietly damning part. The dominant driver, by a wide margin, was the target's own most recent quarter-over-quarter change, followed by its value four quarters ago. Read that again. The strongest signal a flexible learned model could find in free cash flow was the year-ago quarter — which is exactly, precisely, what the seasonal-naive baseline already is.
That reframed the result. Free cash flow is lumpy: working-capital timing, capex that lands in one quarter and not the next, one-off settlements. Its path is closer to noise around a seasonal mean than to revenue's smoother compounding. The predictable part is almost entirely the seasonality, and the baseline captures that seasonality perfectly, for free, with zero estimation variance. The learned models found the same seasonal signal and then piled noise on top of it: parameter variance, reconstruction amplification, all of it. When the learnable signal is thin, extra model flexibility is not extra accuracy. It is extra variance. The bias–variance tradeoff, not as a textbook curve, but as a row on a leaderboard.

The decision: ship the baseline, and say so
So free cash flow is served by the seasonal-naive forecast. The API response and the dashboard both label it as the baseline, in plain words. A user who asks for a free-cash-flow forecast is told that the best available forecast is last year's same quarter.
I considered the alternatives and rejected each for a reason.
Ship the best learned model anyway, so all three targets read as "ML." This is shipping a forecast I know to be worse in order to look more sophisticated. It is the exact dishonesty the whole project was built to avoid.
Drop free cash flow from the product. But the baseline is a genuinely useful forecast and a target users want. Hiding it because the fancy model lost is cowardice dressed as scope control.
Keep tuning until something edged past 1.551. The SHAP result says the ceiling is the data, not the effort. Enough tuning would eventually produce a model that beats the baseline on this particular split by luck, and that is worse than losing honestly.
The requirement that made this trustworthy is uncomfortable: the same protocol that let the LSTM win revenue is the one that crowned the baseline on free cash flow. I did not get to switch yardsticks the moment the answer displeased me.
What it means when a baseline beats machine learning
A baseline is not the thing you beat to justify a model. It is the control that tells you whether there was anything to learn at all. When a baseline beats machine learning, that is not a failed experiment. It is a finding about the data: free cash flow, at one quarter's horizon, from this feature set, carries almost no signal a model can exploit beyond its own seasonality. That is worth knowing, and it is exactly the kind of thing a project usually buries.
A baseline you only trust when your model beats it is not a baseline. It is a formality. Let it win when it wins, ship it when it wins, and the one time your model genuinely does win — as mine did on revenue — nobody has to take your word for it.
This is the assumption the whole post exists to break: that a more sophisticated model produces a better system, and that a negative result means you did something wrong. Neither is true. The most sophisticated thing I could do for free cash flow was to notice that the simplest forecast was the best one, and let it ship.
The last question
That closes the arc. Three investigations, and they turned out to be one lesson in three costumes. The data that would not hold still. The model that could not extrapolate past what it had seen. And the baseline that would not be beaten. In every one, the hard part was never the model.
Which leaves the question I could not answer from inside this project, and the one I most want to. A baseline tells you afterward whether a target was worth modeling — after the features, the five models, the backtest are all built. I would like to know sooner. How do you look at a target, before spending three weeks on it, and estimate whether there is enough signal there to be worth a model at all?
I do not have that answer yet. It is where I go looking next.
This is the final post in a series on FinSight, a next-quarter financial forecasting system built end-to-end from public SEC and FRED data. The seasonal-naive baseline, the five-model leaderboard, and the served-per-target selection described here all live in the repository.

Comments