Why My Model Couldn't Predict Growth

Updated: Aug 3
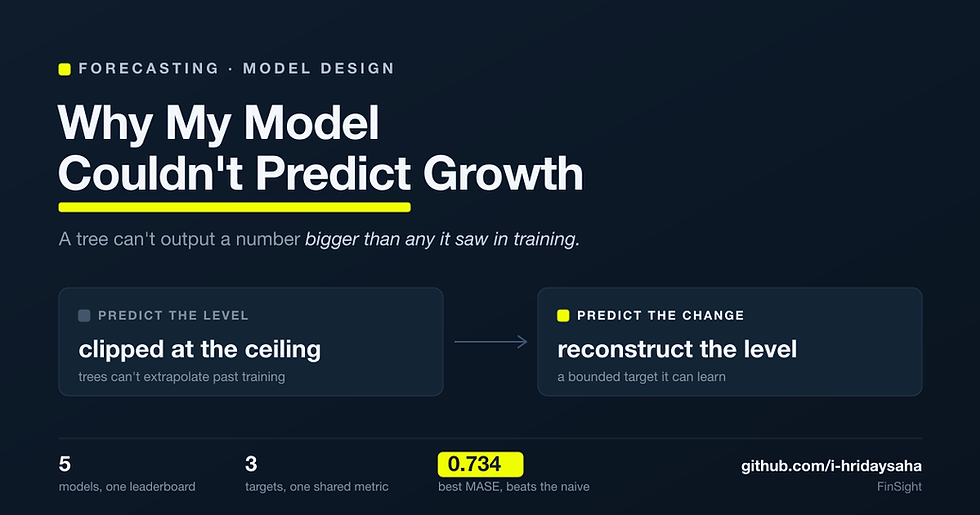
The first honest backtest of my revenue model produced a forecast that looked broken in a very specific way. For companies that were growing, the prediction would track the real numbers for a while and then simply stop climbing. It flatlined, pinned to an invisible ceiling, while the actual revenue kept going up and to the right.
My first instinct was that the model was undertrained, or the features were weak, or I had a bug in the reconstruction. It was none of those. The model was doing precisely what its structure allows and nothing more. The ceiling was not a bug in my code. It was a property of the algorithm I had chosen, and I had been ignoring it because it never shows up in the tutorials.
The assumption I didn't know I was making
FinSight forecasts next-quarter revenue, operating income, and free cash flow for around 117 US companies. Two of the five models I compare are gradient-boosted trees, LightGBM and XGBoost, and they are the sensible default for this kind of tabular, feature-rich problem. My plan was the obvious one: the thing I want to predict is a dollar amount, so I will train the model to predict that dollar amount. Predict the quantity you actually want. What else would you do?
That sentence contains an assumption so natural it is almost invisible: that my estimator is capable of producing the quantity I am asking it for. For a tree, on a growing target, it is not.
Why tree models can't extrapolate
A decision tree makes a prediction by dropping an input down to a leaf and returning that leaf's value. And a leaf's value is just the average of the training targets that landed in it during fitting. That is the entire mechanism.
Follow the consequence. A tree's output is an average of numbers it saw in training. An average of a set can never exceed the maximum of that set. So a tree's prediction is bounded, above and below, by the range of targets it was trained on. It can interpolate beautifully inside that range. It cannot produce a single value outside it. Ever. Not with more trees, not with more depth, not with better features. Put plainly: tree models can't extrapolate.
Now put that against a chronological split, which any honest time-series evaluation demands. I train on data up to 2020 and test on 2021 onward. A company that was doing 40 billion in quarterly revenue in 2020 and grows to 55 billion by 2023 has, in the test years, a true revenue that lies entirely outside the range the model was trained on. The tree does the only thing it can. It returns the largest value it knows and holds there. The forecast flatlines. That is the ceiling I was seeing.
The cruel part is which target this ruins. The most obvious, most natural thing to predict, the revenue level, is the one target a tree structurally cannot forecast for exactly the companies you most want to forecast: the ones that are growing. In a word, the model could not predict growth for the companies where growth was the whole point.
What I tried to make it predict growth, and why most of it was worse
Once I understood the constraint, the problem reframed itself. The question was no longer "how do I make the tree better" but "what should I ask the tree to predict instead, so that the thing I want falls back out." I went through the options roughly in this order.
Raw levels: The starting point, and the one with the ceiling. It has a second, quieter problem too: across a universe spanning small caps and Apple, the tree spends its capacity learning company size rather than company dynamics. The biggest signal in the data is just how big each firm is.
Log or asinh levels: Compressing the scale helps with the size problem. It does nothing for the ceiling. A compressed level is still a level; the maximum just moves. You cannot log your way out of a bound that is structural.
Growth rate: y_next / y_now − 1. Now we are getting somewhere. A growth rate is stationary and scale-free, and it stays inside a bounded range, so the ceiling is gone. But it divides by the current value, and operating income and free cash flow routinely pass through zero or sit at razor-thin margins. Dividing by a near-zero base turns a reasonable target into an exploding one. Fine for revenue, poison for the other two.
Revenue growth plus predicted margins: Economically elegant, reconstruct income from a growth forecast and a margin forecast. But now two separately predicted quantities have to be multiplied back together, and their errors compound. I would be trading one clean prediction for two noisy ones and hoping the noise cancelled.
A differenced change: Predict the one-step change in the target, then add it back to the known current value.
The decision: predict the change, report the level
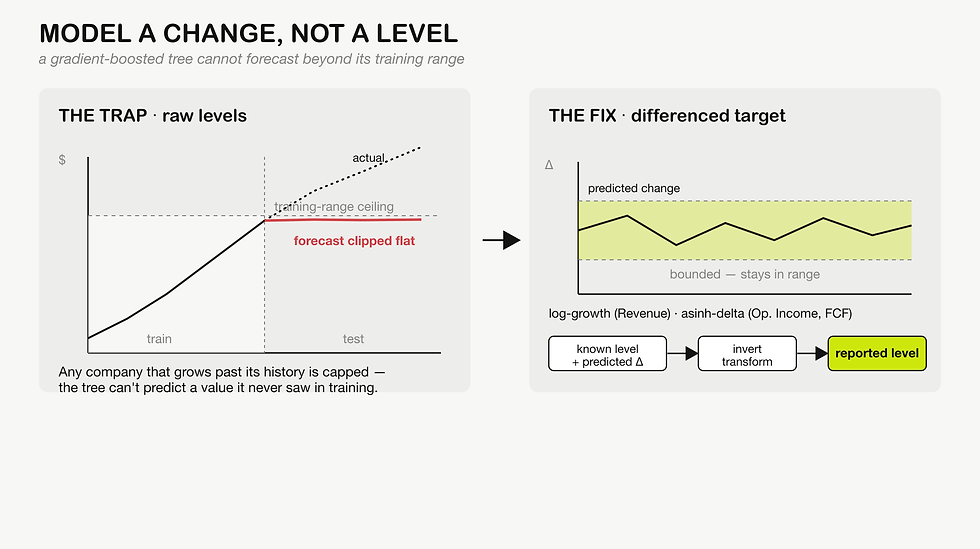
The differenced approach is what shipped, and the reasoning is worth being precise about because it is not just "differencing makes things stationary," the line every time-series course repeats.
The model predicts a change, not a level:
For revenue (always positive), the change is log-growth.
For operating income and free cash flow (which cross zero, where logs are undefined), it is an asinh-delta, using the inverse hyperbolic sine, which behaves like a log for large magnitudes but is defined for negatives.
The reported dollar figure is then reconstructed: take the known current quarter, add the predicted change, invert the transform. The level I actually want falls out of a change the model can produce.
This clears the ceiling, because a quarter-over-quarter change lives in a bounded, roughly stationary range that looks the same in 2015 and 2023, so the test years no longer fall outside the training range. But it also removes a second burden I had not fully appreciated. A tree cannot learn arithmetic. "Take the input and add a delta to it" is not something a tree can represent through splits; it would have to memorize the relationship piecewise, badly. By handing the model the delta as the target directly, I stop asking it to reinvent addition through a thousand thresholds and let the reconstruction step, which is just arithmetic, do the arithmetic.
There is a cost, and honesty about it matters. The asinh transform is near-linear near zero and log-like for large values, so companies whose free cash flow ranges from single-digit millions to tens of billions sit in genuinely different regimes of the same transform. Fixing units mitigates it but does not erase it. This is a real limitation, not a solved problem, and I would rather name it than let it hide.
The principle worth keeping
Model the transform your estimator can actually produce, then reconstruct the quantity you report. Don't force an estimator to predict something its structure forbids.
The instinct when a model underperforms is to reach for a bigger model, more features, more tuning, more data. But no amount of any of those fixes a structural limitation. A gradient-boosted tree that cannot exceed its training range will not learn to exceed it with a deeper grid search. The fix was not to try harder at the impossible thing. It was to change what I predicted so the impossible thing was never asked.
This generalizes past trees and past finance. Any bounded-output estimator, anything whose predictions are confined to a region of what it has seen, has some version of this trap. When the quantity you need to report lies outside what your model can structurally output, change the target before you change the effort. Predict something inside the model's reach, and compute your way back to what you actually want.
The next question
Reshaping the target got the trees off the floor. But it raised a question I could no longer avoid. Once every model, the trees, an LSTM, Prophet, and a dead-simple seasonal baseline, is predicting a properly reshaped target and scored on the same reconstructed levels, does all this machinery actually beat just guessing that next quarter looks like the same quarter a year ago?
For one of my three targets, the honest answer was no. The baseline won, and I shipped it. That is the next investigation.
This is part of a series on FinSight, a next-quarter financial forecasting system built end-to-end from public SEC and FRED data. The differenced-target transform, the reconstruction step, and the five-model comparison described here all live in the repository.

Comments